Article
Board Builder - Unthread
3 min read
Last updated 3 months ago
Introduction
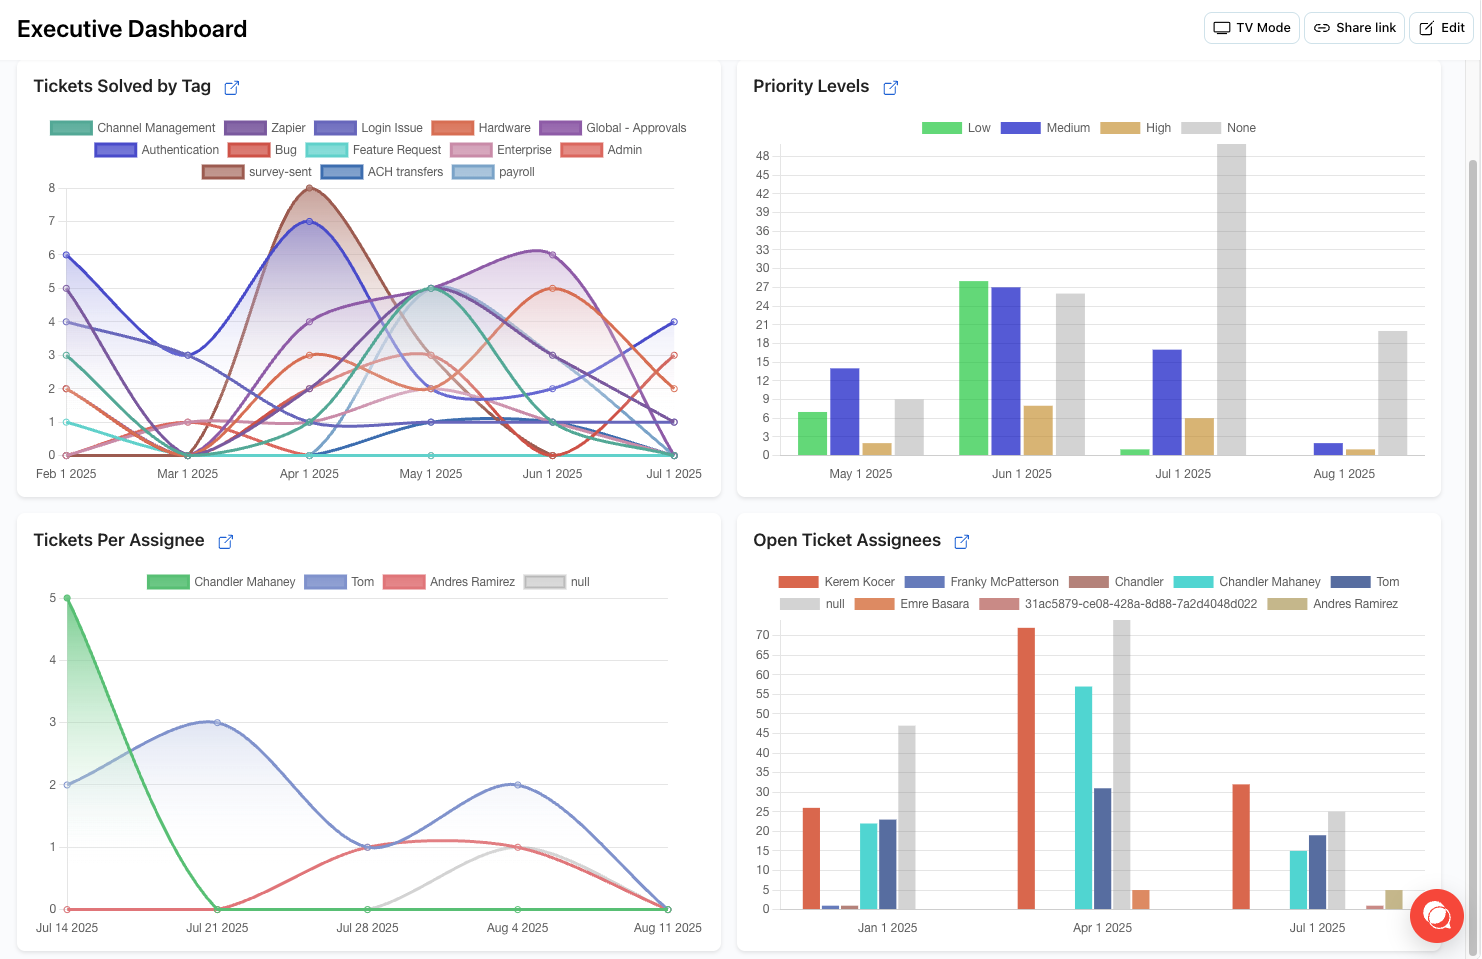
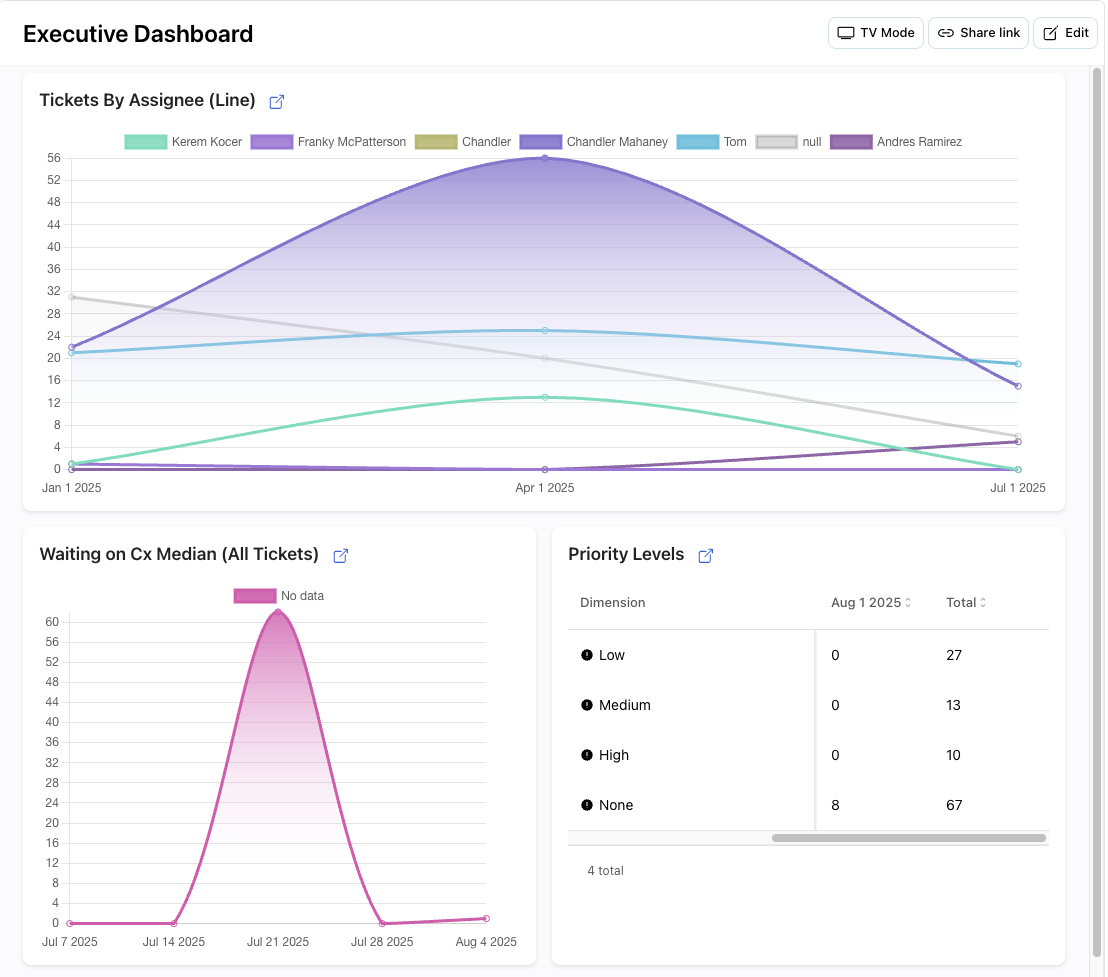
Navigate to Analytics > Board Builder to create powerful live dashboards by combining existing reports. Our Board Builder allows you to combine saved reports into a single view. You can use these boards to track metrics that are most important to you or use the TV Mode feature to output this to a display for real-time updates.
Creating Your Dashboard
Step 1: Access Board Builder
- Go to Analytics > Board Builder in your dashboard
- Click “Create New Board” to start building
- Give your board a descriptive name
Step 2: Add Reports
- Select from your saved reports
- Choose the layout and positioning for each report
- Configure display options for each widget
Step 3: Customize Your View
- Layout Options - Choose from grid layouts to arrange your reports
- Size Controls - Resize reports to emphasize important metrics
- Auto-refresh - Set refresh intervals for real-time updates
TV Mode
Use TV Mode to display your dashboard on a monitor or TV screen for:
- Team visibility - Keep everyone informed of current metrics
- Real-time monitoring - Display live updates during busy periods
- Executive dashboards - Provide leadership with key insights
- War rooms - Centralized monitoring during critical situations
Setting Up TV Mode
- Create your board with the reports you want to display
- Click Preview
- Select TV Mode
Best Practices
Dashboard Design
- Keep it focused - Include only the most important metrics
- Use consistent layouts - Maintain visual hierarchy
- Consider your audience - Tailor content for different stakeholders
- Regular updates - Refresh dashboards as your needs evolve
Performance Optimization
- Limit report count - Too many reports can slow performance
- Use appropriate date ranges - Shorter ranges for better performance
- Apply filters - Reduce data volume for faster loading
- Schedule updates - Set reasonable refresh intervals
Common Use Cases
Executive Dashboard
- High-level performance metrics
- Customer satisfaction scores
- Volume trends
- Team productivity indicators
Operations Dashboard
- Real-time response times
- Open conversation counts
- Agent workload distribution
- SLA compliance metrics
Team Dashboard
- Individual performance metrics
- Channel-specific data
- Quality indicators
- Improvement opportunities